What Close Games Measure
Earlier work · Steve Raymond
Across nine seasons, 129 FBS programs played 4,967 games decided by eight points or fewer. They won 50.6% of them.
Not roughly half. 50.6% — which is what you get if every one of those games is settled by a coin.
That sentence is easy to write and hard to believe, because close games are where the sport locates its virtues. Poise. Finishing. Fourth-quarter coaching. Programs fire people over them. So the rest of this is the work of trying to rule out the coin, and failing.
The distribution
If closing were a stable skill, programs would separate. The good ones would cluster high, the bad ones low, and the spread across the league would be wider than chance alone can produce.
So build the league where it isn't. Every close game a coin flip, weighted to the observed base rate, each program dealt exactly as many games as it actually played. Run it twenty thousand times and compare.
| Observed | Coin-flip league | |
|---|---|---|
| Spread across programs (SD) | .0876 | .0831 |
| Best program | .730 | .727 |
| Worst program | .278 | .288 |
| Programs beyond ±1.96 SD | 6 | 6 |
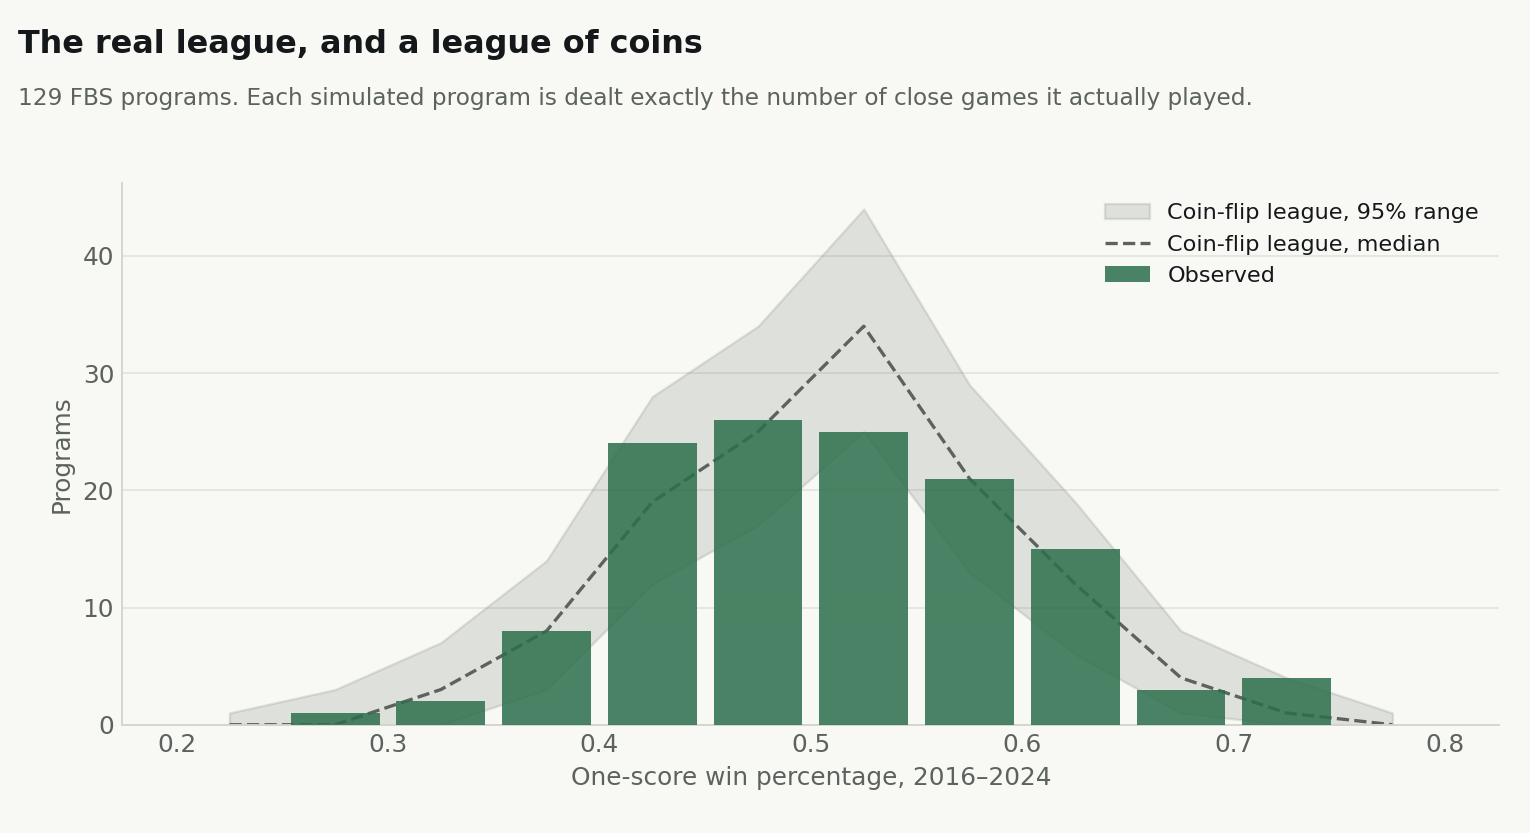
The observed spread is 5.4% wider than pure chance. Six programs clear the conventional significance threshold, and a league of coins produces six. The best and worst records in nine years of college football sit within four thousandths of what the coins produce.
That is not a weak effect. It is the absence of one.
Whether it carries
A second test, independent of the first. If a program has a real closing ability, this year's close-game record should tell you something about next year's. Across 947 season pairs:
| Measure | Year to year | Within program |
|---|---|---|
| Point margin per game | 0.579 | 0.193 |
| Total production | 0.575 | 0.224 |
| Overall win percentage | 0.477 | 0.125 |
| One-score win percentage | 0.022 | −0.102 |
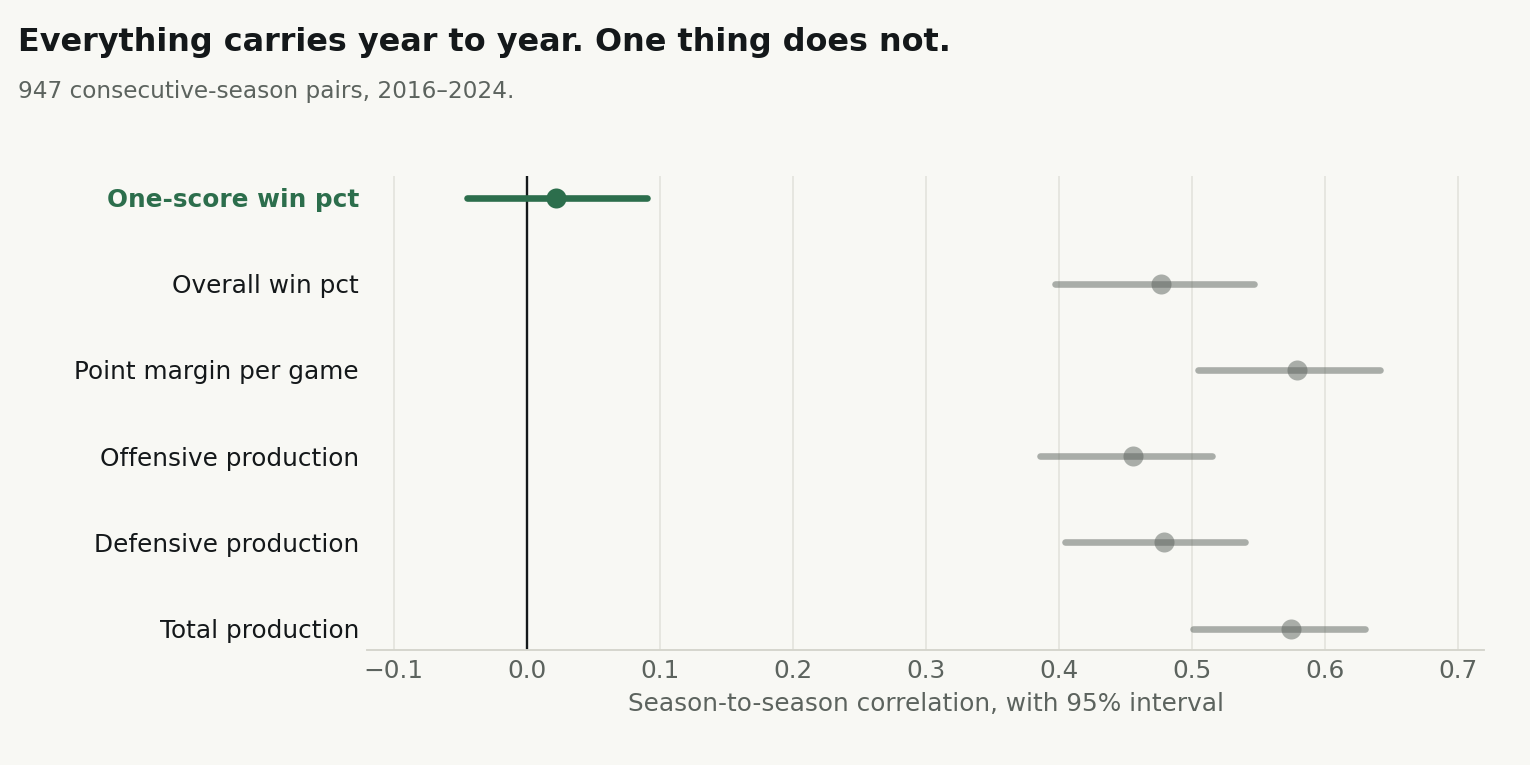
Everything a program does carries from one season to the next. How well it plays, how much it outscores people by, how often it wins. All of it persists at between 0.48 and 0.58.
Close-game record persists at 0.022, with a confidence interval that straddles zero. Hold the program constant and compare it against itself over time and the number turns negative — a team that wins close games one year is very slightly more likely to lose them the next. That is the signature of regression, not skill.
And across every program with eight or more qualifying seasons, not one finished above .500 in all of them, or below .500 in all of them. Nine years is long enough for a real closing ability to show itself. Nobody showed one.
The extremes
The programs at each end are not who a skill story would predict. Production percentile in parentheses — where each program ranked league-wide in how well it actually played.
| Worst in close games | Record | Production |
|---|---|---|
| Nebraska | 15–39 | 50th |
| Arkansas | 13–28 | 42nd |
| Florida Atlantic | 10–21 | 49th |
| Kansas | 12–21 | 34th |
| Massachusetts | 8–14 | 17th |
Three of the five worst closing teams in college football played at or near league-average quality. Nebraska, the very worst, sat at the exact median.
Nebraska's margin is the one worth pausing on. Their z-score is −3.35, and in the simulated league the worst program lands at or beyond that 4.4% of the time. Uncommon. Not extraordinary. What the tail of a noise distribution looks like when you run the sport for nine years.
What this is useful for
Two things, neither of them a recommendation.
Evaluation. A win-loss record is a noisy instrument, and it is noisiest exactly where it costs the most — in the games that decide bowl eligibility, extensions and jobs. A program whose games are tight will be misread in both directions, and the misreading will look like evidence.
Expectation-setting. If close-game outcomes cannot be predicted from quality of play, a program cannot plan to improve them. It can plan to be better on a per-snap basis and let the margins land where they land. Any staff that believes it has fixed its close-game problem should check whether the record simply regressed.
What this does not support is a diagnosis. Somewhere inside those 4,967 games there may be real, coachable differences in how teams handle the last four minutes. This analysis cannot find them, and neither can anyone working from public data alone. The honest claim is narrower and more useful: whatever those differences are, they do not accumulate into a record.
Method
Nine seasons, 2016 through 2024. 129 FBS programs, 4,967 games decided by eight points or fewer. Simulation draws each program's games from a binomial at the observed league base rate of .5057, 20,000 iterations, seeded and reproducible. Persistence measured as the correlation between consecutive-season values, reported both across the league and within program after demeaning; bootstrap confidence intervals clustered by school. Sustained-run counts restricted to programs with at least eight qualifying seasons and at least three close games per season.
Production percentiles come from 48 opponent-adjusted unit metrics from CollegeFootballData.com, z-scored within season.