The Nebraska Margin
Earlier work · Steve Raymond
In 2021, Nebraska outscored its opponents by an average of 5.2 points per game and finished 3–9.
That is the widest gap between how a team played and what it earned in nine seasons of FBS football. Not the widest that year. The widest, full stop, across 1,118 team-seasons.
It is also the cleanest example of something that shows up across the entire sport once you look for it, and it is not the thing most people assume about Nebraska.
The premise that turns out to be wrong
The received story is that Nebraska spent enormous money and got nothing for it. The spending half of that is true in absolute terms — football expenses rose from $36.6 million in 2016 to $70.6 million in 2024, a 93% increase. The program has consistently ranked in the top quarter of FBS in football spending, and finished the period 12th.
The "got nothing for it" half is where it breaks down.
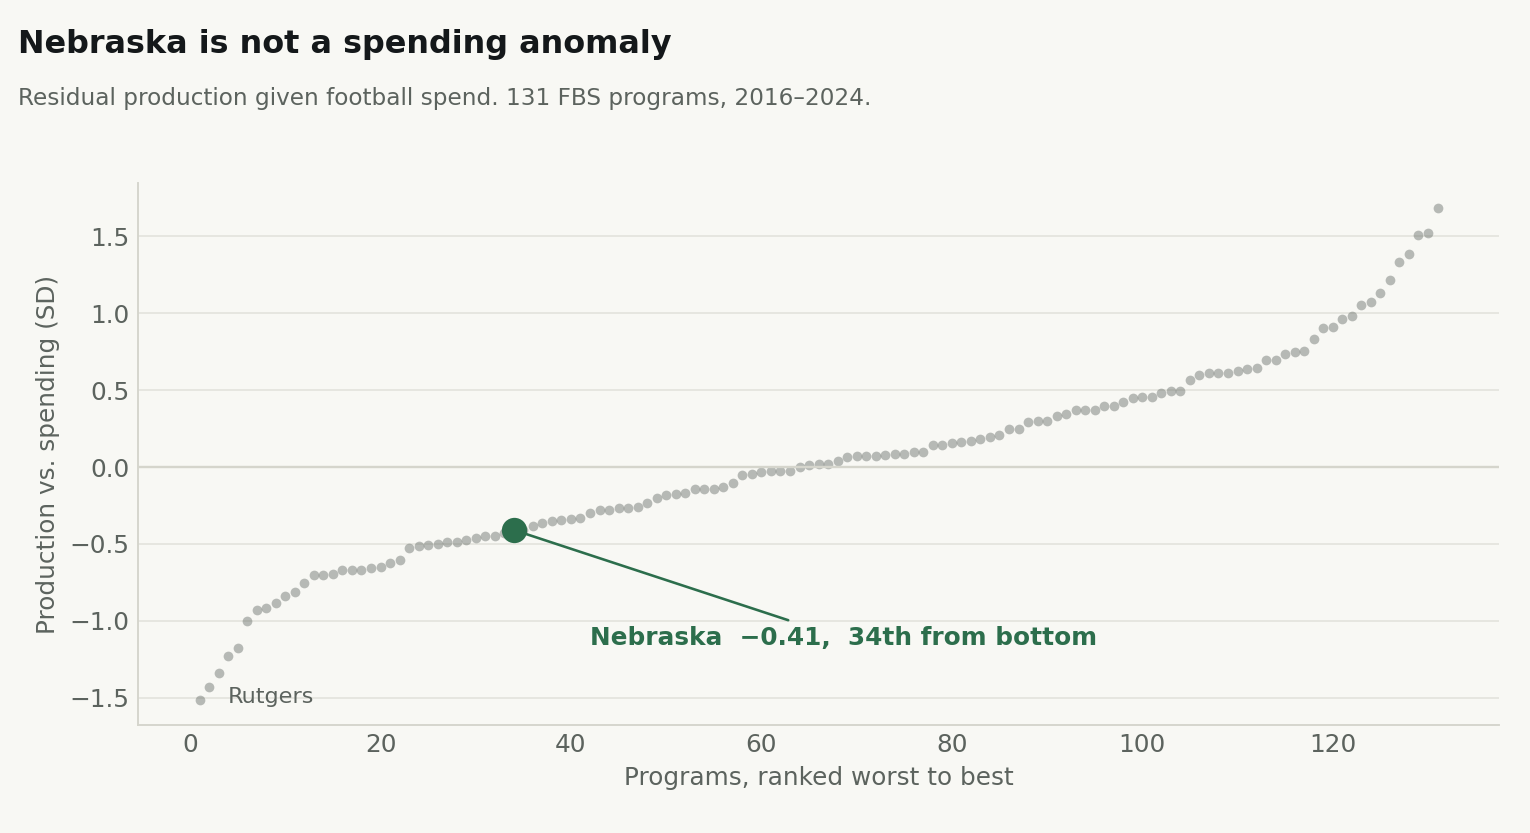
Measured against what programs at their spending level typically produce on the field, Nebraska sits at −0.41 standard deviations — 34th from the bottom out of 131 programs. That is below average. It is not remarkable. Rutgers (−1.51), Vanderbilt (−1.43), UConn (−1.34) and Stanford (−1.23) all miss by roughly three times as much.
Restrict the comparison to the 101 programs present in all nine seasons and Nebraska ranks 26th from the bottom. Still below average, still unremarkable, still nowhere near an outlier.
So the first finding is a negative one: Nebraska is not a spending anomaly. They bought roughly average production with above-average money, which describes a large share of college football.
Where they are genuinely unusual
Change the question from what did their money buy to what did their play earn and Nebraska stops being ordinary immediately.
Comparing wins against what each program's own on-field production predicts, Nebraska is −0.91 standard deviations, the largest such gap among 131 programs. Kansas and Louisville follow at −0.76, and no one else is close to the top three.
Their production was not the problem. Across the nine years their offensive and defensive indices are unexceptional but not bad, and in several seasons they were clearly above average on both sides. In 2021 — the 3–9 season — Nebraska posted above-average production on offense and defense and finished with a +5.2 scoring margin.
The record simply did not follow.
The mechanism
Across all 106 games in the window, the split is stark:
| Record | Win % | |
|---|---|---|
| Games decided by 8 points or fewer | 15–39 | .278 |
| Every other game | 29–23 | .558 |
In games that were not close, Nebraska had a winning record. In games that were close, they lost nearly three-quarters of the time, across 54 games and nine seasons and three head coaches.
Their average scoring margin across the entire period was −1.0 points per game, against a 44–62 record.
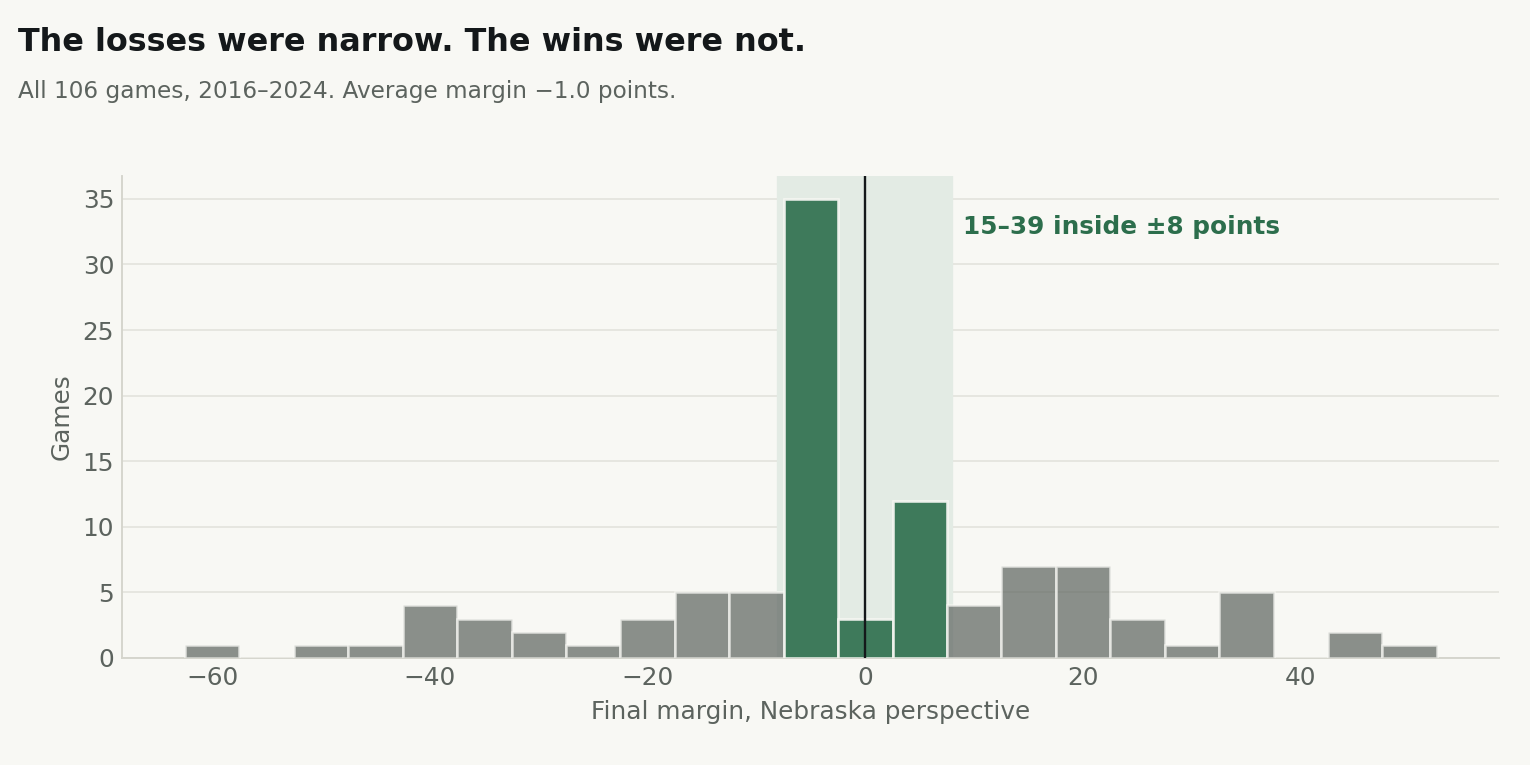
They were not outplayed. They were out-finished, over and over, for a decade.
The part that isn't about Nebraska
The natural response is to reach for an explanation. Clock management. Quarterback play in the fourth quarter. Kicking. Something cultural.
Before reaching for any of it, consider how well close-game outcomes can be predicted from quality of play anywhere in FBS.
Across all 48 unit metrics, controlling for prior-season program strength and year effects, the mean absolute association with each outcome:
| Outcome | Mean association |
|---|---|
| Point margin | 0.377 |
| Win percentage | 0.326 |
| Margin vs. top-25 opponents | 0.245 |
| One-score win percentage | 0.074 |
Close-game record is very nearly unpredictable from how well a team plays. Not weakly predictable — nearly unpredictable, at a fraction of the strength of every other outcome tested.
Which reframes the Nebraska result, and it is worth being precise about how far the reframing goes. Simulate a league in which every close game is settled by a coin flip, and the worst program across a nine-season run lands at or beyond Nebraska's margin 4.4% of the time. That is uncommon. It is not extraordinary. It is what the tail of a noise distribution looks like.
So a 54-game run of one-score losses is a genuinely extreme draw from a distribution that is otherwise close to indistinguishable from chance. It is not evidence of a specific defect, because the data cannot distinguish a specific defect from bad luck at that scale. The programs that come out well on this measure are not obviously better coached in the fourth quarter than the ones that come out badly.
That is an uncomfortable conclusion, and it is the honest one. It is also the reason this is worth flagging rather than explaining.
What this is useful for
Two things, neither of them a recommendation.
Program evaluation. A record is a noisy measure of a season, and it is noisiest exactly where it hurts most — in the close games that decide bowl eligibility, contract extensions, and job security. Nebraska's nine-year record understates the quality of the football played, by more than any other program in the sport. Any evaluation built on wins alone will systematically misread teams whose games are tight.
Expectation-setting. If close-game outcomes are largely unpredictable from play quality, then a program cannot reliably plan to improve them. It can plan to be better on a per-snap basis and let the margins fall where they fall. Nebraska's 2024 season — 7–6, the best record in the window, with production roughly in line with prior years — is consistent with regression rather than repair.
What this does not support is a diagnosis. There may be a real, coachable reason Nebraska lost 39 one-score games. This analysis cannot find it, and neither can anyone working from public data alone.
Method
Nine seasons, 2016 through 2024. 131 FBS programs, 1,118 team-seasons. Production measured with 48 opponent-adjusted unit metrics from CollegeFootballData.com; spending from the Department of Education's Equity in Athletics disclosures, matched to the season each budget cycle covers. Between-program residuals control for spending and year; win residuals control for prior-season SP+ and year. Bootstrap confidence intervals clustered by school. Team-seasons with fewer than six games or thin play-by-play charting were excluded.
Three programs — Air Force, Army and Navy — are absent throughout, as service academies do not file EADA reports.