The Cheap-League Effect
Earlier work · Steve Raymond
Rank college football's conferences by how much they spend, then by how far they beat what that spending predicts, and the two lists run backwards to each other.
The correlation is −0.797. The cheaper the league, the more it overperforms the model.
That is a finding about the model before it is a finding about the leagues, and it is worth saying which way round it goes before going any further.
What the model does
Fit production against spending across nine seasons and 131 programs, and the residual answers a clean question: given what this program spends, how well does it play? Positive residuals are programs beating their budget.
The problem is that spending and conference membership are nearly the same variable. Group of Five programs sit at the bottom of the spending distribution as a bloc, and they play most of their games against each other. A MAC team that goes 9–4 is compared against a national curve calibrated largely on programs spending five times more, and the model reads the schedule as the program.
So a systematic pattern where cheap leagues overperform is what a specification artifact looks like. Any list of programs beating their spending will be crowded with Group of Five teams, and that placement is partly conference membership rather than achievement. Anyone publishing such a list — including me — should say so before the list, not after.
What survives
Ohio appears in the national top ten of between-program residuals. That placement does not survive conference fixed effects. Compare Ohio only against programs facing the same schedule quality and the national ranking moves substantially.
What survives is narrower, and better.
| Ohio | |
|---|---|
| Seasons with a positive residual | 8 of 8 |
| Mean residual (SD units) | +1.13 |
| Range across seasons | +0.05 to +2.03 |
| Leave-one-season-out range | +1.00 to +1.28 |
| Bootstrap 95% interval | +0.66 to +1.62 |
| Mean football spend | $9.9M |
| Mean national spend rank | 108th |
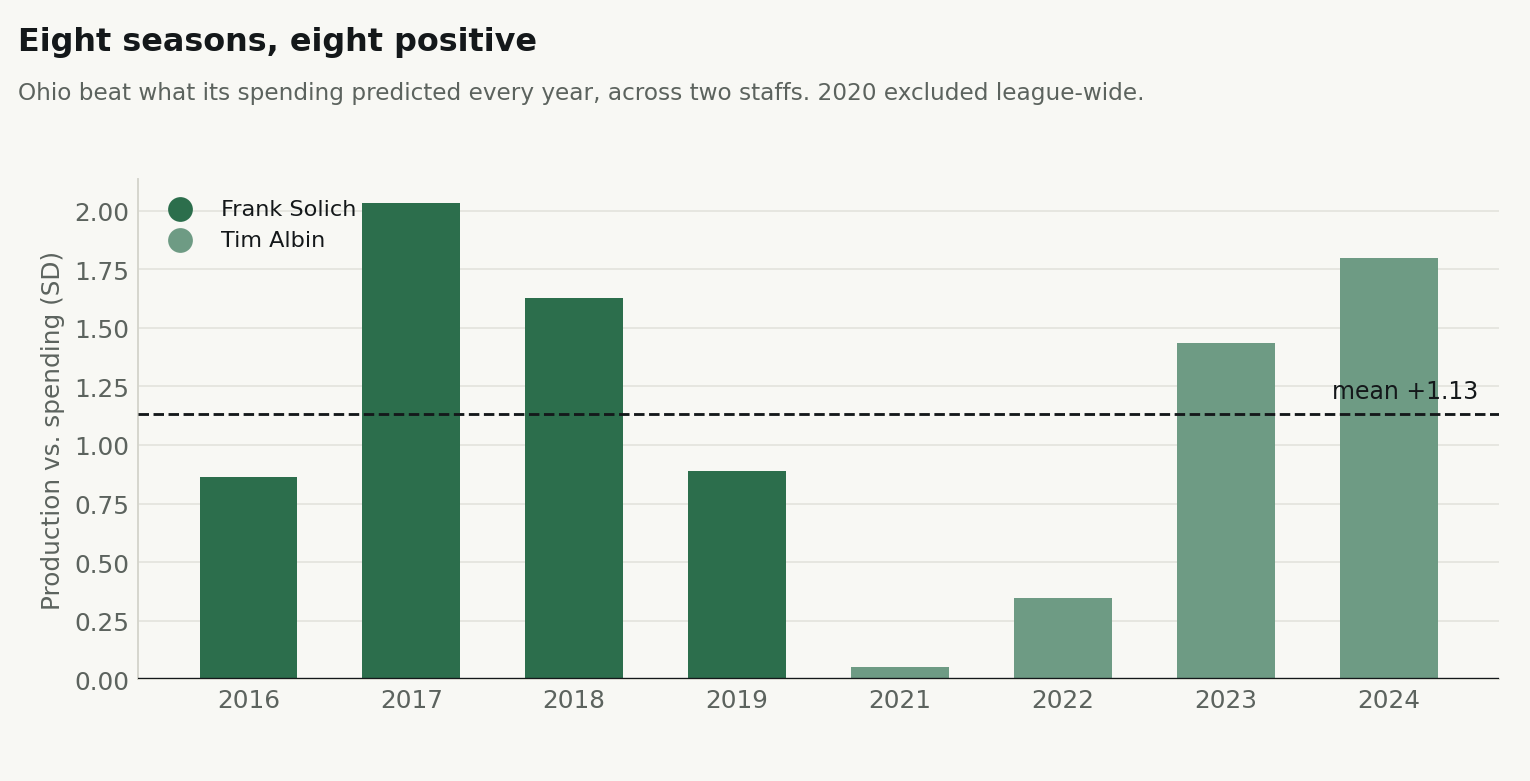
Every season positive. No season carrying the result — drop any single year and the average moves by less than three tenths of a standard deviation. The confidence interval clears zero comfortably. And within the MAC, where the schedule objection does not apply, Ohio ranks first of twelve under every specification tested.
That is a different claim from "seventh best in the country at spending efficiency," and it is the one the data actually supports: the most consistent overproducer in a cheap league, across two coaching staffs, on roughly ten million dollars a year.
Across two staffs
The consistency spans a coaching change, which is unusual enough to describe.
| Record | Residual | Offense | Defense | |
|---|---|---|---|---|
| Frank Solich, 2016–19 | 33–20 | +1.35 | +0.92 | +0.37 |
| Tim Albin, 2021–24 | 34–19 | +0.91 | +0.14 | +0.47 |
Nearly identical records. The overperformance persists. What changes is its composition — the Solich teams carried it on offense, the Albin teams distribute it more evenly and lean slightly toward defense.
I am describing that shift, not testing it. Four seasons per era is not enough to separate a real change from ordinary variation, and the confidence interval on the difference spans zero. Reporting it as a finding would be exactly the error this piece opens by warning about.
What this is useful for
For anyone building a spending-efficiency measure: control for conference, or state plainly that you haven't. The uncontrolled version will hand you a list of Group of Five programs and the appearance of an insight. Roughly four-fifths of the variation in league-level overperformance is explained by how much the league spends.
For programs in cheap leagues: the national rankings flatter you, and the within-conference comparison is the one that means anything. Ohio's case is strong precisely because it holds up when the flattering comparison is removed.
What this does not support is a mechanism. Ohio beat its budget for nine years across two staffs, and this analysis cannot say why. Public spending data arrives as a single annual lump sum — no split between salaries, facilities, recruiting and operations — so the question of what they did differently is not answerable from here.
Method
Nine seasons, 2016 through 2024, 131 FBS programs. Production measured with 48 opponent-adjusted unit metrics from CollegeFootballData.com, z-scored within season and averaged into a single index. Spending from the Department of Education's Equity in Athletics disclosures, log-transformed and standardised within season. Residuals from three specifications: linear in log spend, cubic in log spend, and linear plus conference fixed effects. Bootstrap confidence intervals clustered by school. Ohio has eight qualifying seasons; 2020 is excluded league-wide for schedule irregularity.
Conference-level figures restricted to leagues with at least 30 team-seasons in the panel.